Climate Data
By definition climate data is meteorological observation data, which are more than an hour old. DMI's climate data undergoes quality control by our climatologists, through which data is checked and erroneous data is removed. In addition to the quality controlled climate data, there are several additional parameters available, which are not quality controlled, but is useful to the agricultural sector.
DMI's climate data consists of data from Denmark (DNK) and from North Atlantic Islands Faroe Islands (FRO) and Greenland (GRL). There are, however, some differences between datasets and data availability for Denmark and Greenland/Faroe Islands, respectively. Furthermore there are some key differences in how quality control is performed for Denmark and Greenland/Faroe Islands. One of the differences is that for Denmark data gaps in time and location are patched by interpolating from nearby stations, whereas for Greenland erroneous data are removed and data gaps may occur.
The Climate Data service consists of different spatial resolutions as represented in the table below.
For climate data, there can be a delay in the updates of recent climate data over the next days
stationValue
stationValue is quality controlled meteorological observation data for Denmark and Greenland/Faroe Islands on station level and derived values such as daily, monthly and yearly values which have been calculated for all stations. In addition to the quality controlled data, there are several additional parameters available, which are not quality controlled, but are used by the agricultural sector. For an overview of which parameters are available in the different time resolutions, please see the parameter list. The stations available for the stationValue service can be seen here. stationValue is available from a stations start date until the termination date of the station.
There are some key differences between stationValue for Denmark and Greenland/Faroe Islands respectively, as shown below:
* The manual daily QC entails that data usually is available on the next week day after observation time.
Spatial Resolutions (10kmGridValue, 20kmGridValue, municipalityValue, countryValue)
The climateData service also includes data in different spatial resolutions for Denmark. The data is based on station data from Danish stations, which is interpolated into a 1x1km grid net covering all of Denmark’s land area using a modified inverse-distance algorithm. The calculated values in each grid cell depends on the values of the nearest surrounding station found in 8 sectors. One value is calculated for each area (e.g. one municipality) from the grid cells covering the jurisdiction area combined with a weighting of how much of each grid cell is within the area. The stations are weighted in relation to the distance and climatological comparability (distance to sea) to the grid cell. Aggregated grid cells are used to compile datasets of different spatial resolution.
The different spatial resolutions are calculated/derived from stationValue data as it becomes available. The data is recalculated when the quality controlled stationValue data has been quality controlled by our climatologists. In some instances area data is based on additional parameters, which are not quality controlled. Please see the parameter list for an overview over which parameters are available and whether or not they are quality controlled by our climatologists.
Spatial resolutions are not available for Greenland, as an interpolation algorithm cannot be applied due to the complicated circumstances of the large geographical area, complex topography and low station density.
Read more about the spatial resolutions here.
Climate Normals
A climatological standard normal is the average of a 30-year period of weather data calculated for every month of the year. A climatological standard normal contains information about the expected mean air temperature for January in Denmark and thus gives you an understanding of the weather as it “normally” is.
Climatological standard normals are widely used e.g. within climate monitoring where it serves as a reference to compare weather observations with. When climatological standard normals are compared to current weather observations they help you understand whether the mean air temperature is higher or lower than average.
Climatological standard normals are calculated on the basis of quality-controlled station data. In general, the calculations can be divided into four groups; averages, extreme values, accumulated values and event counts. For a detailed description of the climate normal calculation methods, please read WMO Report 1203 (external site).
Regarding Greenland
In certain cases, the data behind the climate normal is not sufficient due to missing data in the climate normal period. In such cases the full climate normal from e.g. 1991-2020 cannot be calculated. Instead of leaving out valuable data from stations that do not have the full data coverage from 1991-2020 shorter averages are calculated:
- Period averages: Averages of climatological data computed for any period of at least ten years starting on 1 January of a year ending with the digit 1 (WMO Report 1203).
- Averages: The mean of monthly values of climatological data over any specified period of time (not necessarily starting in a year ending with the digit 1) (WMO Report 1203).
At least ten years of data has been prioritized, but in certain cases e.g. due to unique locations averages has been calculated for fewer years.
Reference Values
Technically, the calculation of a reference value is the same as with a climatological standard normal; however, the period it covers is shorter than the 30-year period that is characteristic for the climatological standard normal values. The reference values normally cover a period of 10 years, but the period can be both longer and shorter. A reference value thus contains an average of e.g. the mean temperature for each month during the year calculated on the basis of a number of year’s data for the month in question e.g. the average temperature for January in Denmark.
The reference values are used in different contexts. One example is to illustrate how the weather in the last decade was, compared to the actual weather observations.
10-year reference values will not have the same climatological weight as the 30 years climatological standard normals, since weather related coincidences could affect the calculations.
A reference value is calculated on the basis of quality-controlled station data. In general, the calculations can be divided into calculations of the average, extreme values, accumulated values and event counts.
For a more detailed description of the calculations of climatological standard normals, see the WMO-report 1203 (external site).
Quality Control
Meteorological observation data may contain various errors and data outages. When potential errors are identified they are investigated closely. For example by looking at raw observation data or including other data sources such as nearby stations or other parameters which can help to conclude whether the data must be excluded. Errors are typically due to malfunction of instruments caused by wear and tear or exposure to weather and on rare occasions vandalism.
Typical errors in the observations are unrealistically high or low outliers or small but consistent biases. Furthermore certain stations can be misleading for longer periods, if the station observes data deemed unrepresentative by DMI's climatologists.
Quality Control DNK
stationValue for Denmark undergoes manual quality control on multiple levels:
- Spatial controls on a daily, monthly and yearly level are performed by visually inspecting interpolated grid maps on which the station data plotted
- Visual control of the station series are preformed based on time plots
Erroneous or missing data values are filled in by interpolated values derived from surrounding data.
The manual daily QC entails that data usually is available on the next week day after observation time.
Yearly Quality Control
Climate data from DMI’s open data is quality controlled daily, monthly and annually, and is usually ready in February. Unfortunately, the quality control status (qcstatus) does not indicate whether or not the data has undergone the yearly quality control. Release notes for the climate data service will be updated, when data has undergone the yearly quality control.
For waste management data packs (danish: deponipakker), DMI recommends to first download the data after it has undergone the annual quality control. Waste management data packs (danish: deponipakker) usually include wind direction, wind speed, mean temperature, precipitation, potentiel evaporation, and relative humidity.
Quality Control GRL/FRO
stationValue for Greenland/Faroe Islands undergoes manual quality control to ensure the data quality:
- At the beginning of every month, all data from the previous month is manually checked from a time series plot
- Identified erroneous data will be labeled as excluded (see validity property here)
- In certain cases erroneous data is replaced by a manually estimated value
Excluded values are not included in derived values. Derived values contain information on the amount of data behind the calculations.
Time Resolutions and Types of Days
Station values are available in the following time resolutions:
- Hour
- Day
- Month
- Year
- 10 years (also called reference values)
- 30 years (also called climate normals)
Station values are derived from meteorological observations and represent a parameters value in a specific time interval. For example, the mean temperature of the day November 3rd 2012 for a given station.
However, the exact time a certain time resolution begins and ends depends on the time zone, and how the time resolutions above are defined. Due to historical reasons the time resolutions can differ for the different parameters. Time resolutions also differ between stations values for Denmark and Greenland/Faroe Islands
The response properties from and to will tell you the exact time interval covered by the station value. If you want to query for station values in a specific time time interval, you will need to know how time resolutions and types of days work.
Hour
Hourly station values are always in UTC. This avoids any confusion that might arise if summer- and winter time was used. The API supports querying time ranges with time zones, so no special knowledge is needed for querying hourly values in a specific time range.
Day
Daily station values operate with different definitions of what a day is. The different definitions can be seen below.
The type of day used for a station value, depends on the parameter of a station value. You can see a list of which parameters use which type of day here.
Month
Monthly station values are derived from daily station values. They begin when the first day of the month begins, and end when the last day of the month ends.
Example:
The monthly station value for the parameter mean_temp in March 2018 for a Danish station would represent the time range: 1/3/2018 00:01 CET - 31/3/2018 24:00 CEST. Notice the change to summertime, which happens in Denmark on the last Sunday of March.
Even if a parameter has monthly station values but not daily values (as per the parameter table), the month still begins and ends at the time as the first and last day would have begun and ended if they existed.
Year
Yearly station values are derived from daily station values. They begin when the first day in the year begins (January 1st), and end when the last day in the year ends (December 31st).
Example:
The yearly station value for the parameter mean_temp in 2018 for a Danish station would represent the time range: 1/1/2018 00:01 CET - 31/12/2018 24:00 CET.
Even if a parameter has yearly station values but not daily values (as per the parameter table), the year still begins and ends at the time the first and last day would have begun and ended if they existed.
10 years - reference value
Municipality values are derived from daily municipality values for Climatological reference values (see below). for the period 2011-2020
The specific timerange for the data collection is:
the time range: 1/1/2011 00:01 CET - 31/12/2020 24:00 CET.
and exist for danish municipalities only.
Note, that due to the statistical nature of the data and the very long time period, the period is just described as:
2011-01-01T00:00:00+00:00 to 2020-12-31T23:59:59+00:00
30 years - climate normals
Station values are derived from daily station values for Climatological normal values (see below), which at present the two 30 year periods
1961 - 1990
1991 - 2020
and exist for stations on Greenland and the Faroe Islands only (GRL and FRO).
The specific timeranges for the data collections, in UTC, are:
01/01/1960 06:00 - 01/01/1991 06:00 for GRL and FRO
01/01/1991 06:00 - 01/01/2021 06:00 for GRL
01/01/1991 00:00 - 31/12/2020 24:00 for FRO
Note, that due to the statistical nature of the data and the very long time period, the period is just describes as:
1961-01-01T00:00:00+00:00 to 1990-12-31T23:59:59+00:00
1991-01-01T00:00:00+00:00 to 2020-12-31T23:59:59+00:00
Codes
Some of the parameters can assume special values which are not to be taken literally, but are codes for special cases or conditions. The codes currently in the system are listed below.
Precipitation Codes
The parameters acc_precip, max_precip_past24h, acc_precip_past12h, acc_precip_past24h and max_precip_30m return the amount of precipitation within the given period in mm with the exception of the codes listed below.
Wind Direction Codes
The parameters mean_wind_dir & mean_wind_dir_min0 return the direction from which the wind blows in degrees, where north is given as 360.
Cloud Cover Codes
The parameter mean_cloud_cover is reported in oktas (eights) and is the fraction of the sky covered by cloud of any type or height above the ground.
Parameters
On this page you can find a table of parameters for which climate data values are available for download through the climate data service.
The calculation methods for the stationValue parameter values are described in a separate table.
Parameters for stationValue
The available parameters, the parameter and whether our climatologists perform quality control (QC) for the respective parameters.
Click here to see which resolutions data are available.
^For bright_sunshine, the algorithm to calculate hours of sunshine has been changed since week 11 2026.
* The last 5 parameters in the table above are additional parameters, which are not quality controlled by DMI's climatologists. As a result, data can be erronous.
** Read more about the different types of days here.
*** 30 years reference values, currently for the periods 1961-1990 and 1991-2020
Parameters for 10x10km, 20x20km, municipality values, and country values
The available parameters, the parameter and whether our climatologists perform quality control (QC) for the respective parameters.
Click here to see which resolutions data are available.
* The last 5 parameters in the table above are additional parameters, which are not quality controlled by DMI's climatologists. As a result, data can be erronous.
** Read more about the different types of days here.
*** Decadal values from 2011-2020 only for municipalities
Calculation Method for stationValue Parameters
In the table below, the calculation method for stationValue parameter values is described for the available time resolutions. In case of differences between Denmark and Greenland, these differences can be seen in the table below.
Calculation method of mean_vapour_pressure (daily value)
The mean_vapour_pressure is calculated from the hourly values of mean_temp and mean_relative_hum. For every of the days hourly value, where temperature (tt) and relative humidity (rh) is available, the mean_vapour_pressure (vp) is calculated using the following formula:
If tt = 0, then vp = 6.107 * rh / 100
If tt < 0, then
a = 9.5
b = 265.5
q = a * tt / (tt + b)
vp = 6.107 *10q * rh / 100
If tt > 0, then
a = 7.5
b = 237.3
q = a * tt / (tt + b)
vp = 6.107 *10q * rh / 100
The daily value of mean_vapour_pressure is calculated as a mean of the hourly values, which could be calculated within the day.
Calculation method for max_wind_speed_3sec
max_wind_speed_3sec is found in a 24 hour time interval from 00 to 24 local. In this interval the observation at 00:00 is not included in the calculation, but the observation at 24:00 is included in the calculation.
Calculation method for vapour_pressure_deficit_mean
The vapour_pressure_deficit_mean is calculated from the hourly values of mean_temp and mean_relative_hum. The daily value of mean_vapour_pressure is calculated as a mean of the hourly values, which could be calculated within the day.
If mean_temp > 0 then,
SatVapPres = 0.611 * Math.exp (17.27 * mean_temp / (mean_temp + 237.3))
If mean_temp <= 0 then,
SatVapPres = 0.611 * Math.exp(21.87 * mean_temp / (mean_temp + 265.5))
VPD = SatVapPres * (100 – mean_relative_hum) / 100
Spatial Resolutions
The climateData service includes data in different spatial resolutions for Denmark.
The data is based on station data from Danish stations, which is interpolated into a 1x1km grid net covering all of Denmark’s land area using a modified inverse-distance algorithm. The grid is based on Det Danske Kvadratnet's (external site) 1x1km grid with the grid name DKN_1km_ETRS89. The calculated values in each grid cell depends on the values of the nearest surrounding station found in 8 sectors. One value is calculated for each area (e.g. one municipality) from the grid cells covering the jurisdiction area combined with a weighting of how much of each grid cell is within the area. The stations are weighted in relation to the distance and climatological comparability (distance to sea) to the grid cell. Aggregated grid cells are used to compile datasets of different spatial resolution.
The different spatial resolutions are calculated/derived from stationValue data as it becomes available. The data is recalculated when the quality controlled stationValue data has been quality controlled by our climatologists. In some instances area data is based on additional parameters, which are not quality controlled. Please see the parameter list for an overview over which parameters are available and whether or not they are quality controlled by our climatologists.
Spatial resolutions are not available for Greenland, as an interpolation algorithm cannot be applied due to the complicated circumstances of the large geographical area, complex topography and low station density.
Interpolation Algorithm – Grid Data
The stationValue dataset is used to create a 1x1 km grid net covering all of Denmark’s land area. The grid net is calculated from a modified inverse-distance algorithm and is based on all stations that DMI has at its disposal, including both DMI and third party stations. In order to understand the algorithm one must consider the local Danish climate. The overall factor that generally spoken has the largest influence on the local climate in Denmark is the distance to the sea. The uneven station coverage of Denmark's area represents a challenge if using a classic non-weighted interpolation. Areas with bad coverage are in risk of being affected by stations located in an area that climatologically seen is not representative for the point of interpolation. Therefore a modified inverse-distance algorithm is applied, where the value in each grid cell depends on the values of the nearest surrounding stations found in 8 sectors. The stations are weighted in relation to the distance and climatological comparability (distance to sea) to the grid.
The coast-/inland climate distribution follows figure 1 below:
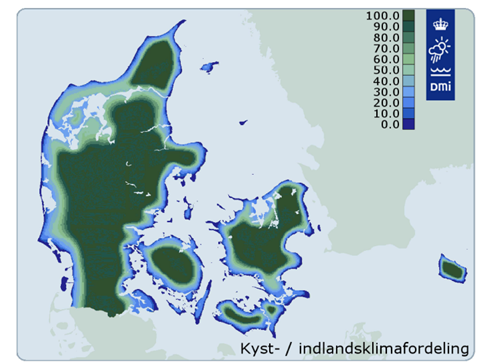
Figure 1. Distribution of coast-/inland climate
Station Selection
Each grid cell value is calculated from weighted station values. A grid cell is not represented by every station equally. Station selection is needed since some stations may be located in a different climate zone or add undesired effects to the grid cell value. The algorithm selects the nearest stations in 8 sectors.
In the following, the station selection method is illustrated for the case shown in Figure 2. The green triangles illustrate stations and the red square is the grid cell to be calculated. The algorithm creates four lines passing through the center of the grid cell, creating eight sectors (ENE, NNE, NNW, WNW, WSW, SSW, SSE, ESE) and finds the nearest station in each sector - aquamarine triangles in Figure 2 right panel.
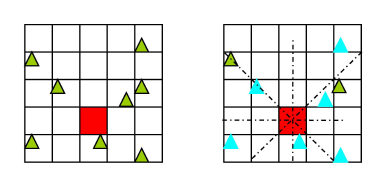
Figure 2. Illustration of the station selection method
The calculated values in each grid cell depend on the values of the nearest surrounding station found in 8 sectors. The stations are weighted in relation to the distance and climatological comparability (distance to sea) to the grid cell. Interpolated values will never exceed the values of the original data the grid network was calculated from. This ensures that "false" records will never appear from the interpolation. This is done for all 1x1km cells covering Denmark’s land area. The 1x1km grid is the calculation basis for all of the spatial resolutions described below. The observation network is embedded into this dataset, i.e. the interpolation algorithm is made so that the 1x1 km grid cell that geographically contains a station, always will have the observed value. The 1x1 km grid net serves as the basis of calculation for the other spatial resolutions.
Spatial Resolutions
The 1x1km grid is then used to calculate a single value for each spatial resolution (e.g. one municipality) from the grid cells covering the specified area combined with a weighting of how much of each grid cell is within the area. Below is shown an example of the 1x1 km grid covering Holbæk Municipality (Holbæk Kommune):
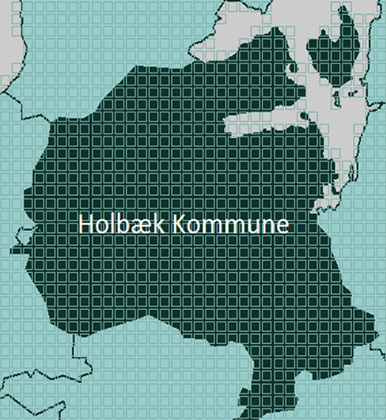
Figure 3. 1x1 km grid covering Holbæk Municipality
Aggregated 1x1km grid cells are used to compile datasets of different spatial resolution:
For a detailed description of the interpolation, see DMI Technical Report 10-13 (the report is in Danish).
Data is made available through DMI’s open data service as soon as it has been calculated, but not yet quality controlled. When the stationValue data has been quality controlled by our climatologists, the data is recalculated and will be updated in the service with any changes to data. In some instances, the data is based on additional parameters, which are not quality controlled. These parameters are agricultural parameters.
Climate data is not available for Greenland in different spatial resolutions, as an interpolation algorithm cannot be applied due to the complicated circumstances of the large geographical area, complex topography and low station density.
Station
Endpoint
It is possible to get the station list through the climateData service by calling the station endpoint. See API documentation for endpoint.
The station list represents both present and historical data about a station - see Station Lists Explained.
List is also available here.
Historical availability
Click here for page displaying the historical availability for each parameter at each station. The noted year is the first year with observations for the given parameter and station.
Station types
The DMI has five types of stations for which measure meteorological parameters. A description of the different station types can be seen below.


